Inventory PAR levels: the formula and how to set them
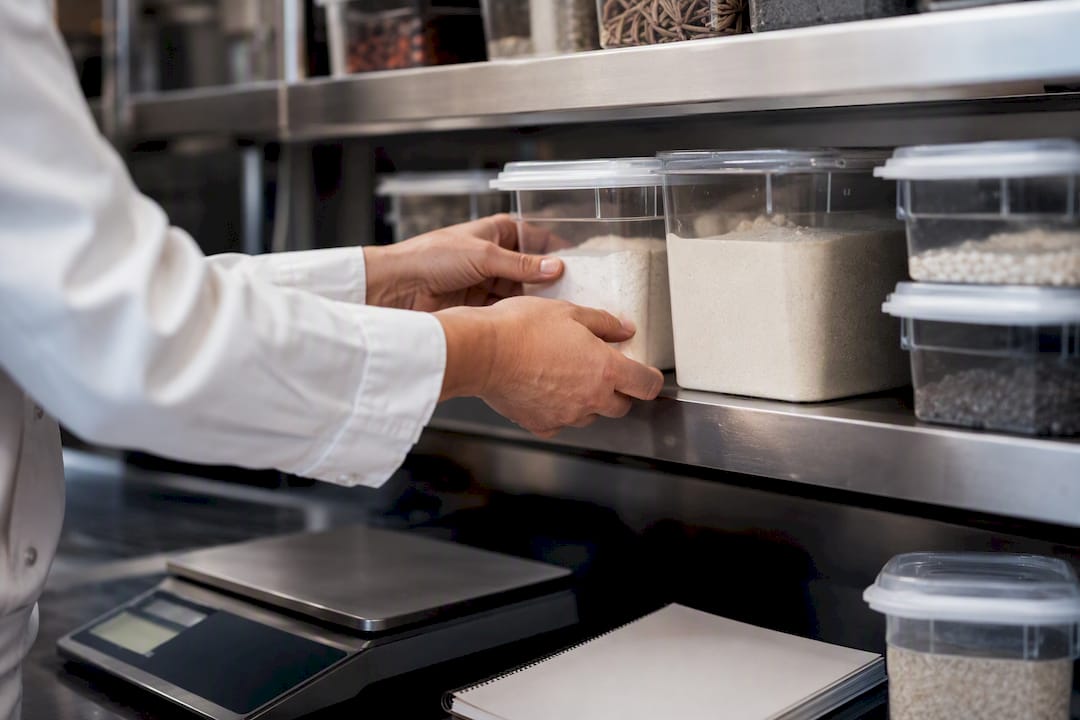
Inventory PAR levels: the formula and how to set them
A PAR level is the amount of stock you keep on hand to cover demand until your next delivery, including a safety stock buffer for the unexpected. “PAR” stands for periodic automatic replenishment, and once you know the number, ordering is simple.
The formula: PAR = (Average usage per period + safety stock) ÷ deliveries per period.
If lead time suits your operation better than delivery frequency, use the alternate form: PAR = (Average daily usage × lead time in days) + safety stock. Both land on the same number when your inputs match.
Once you have that figure, ordering takes one step:
- Order quantity = PAR − stock on hand. Count what’s left on the shelf, subtract it from PAR, and that’s what you order.
Key Takeaways
Setting an accurate par level requires measuring real usage and lead time, sizing safety stock to demand variability, and reviewing the number on a fixed cadence.
| Point | Details |
|---|---|
| Use the right formula | PAR = (average usage + safety stock) ÷ deliveries per period, or usage × lead time plus safety stock. |
| Order quantity is simple | Subtract stock on hand from PAR to get the order amount every time. |
| Safety stock should vary by SKU | Start around 20% and adjust between 10 and 30% based on demand variability. |
| Pilot before you finalise | Run new par levels for two to four weeks and compare against actual usage. |
| Automate once the routine is stable | Caterflowai turns manual par sheets into scheduled reminders, mobile counts, and supply ordering. |
Table of Contents
- What is a par level and when should you use it?
- Why par levels matter for your operation
- Par level vs reorder point: which one fits your stock?
- How do you calculate a par level step by step?
- Worked examples: three par level calculations you can copy
- How do you set up a par sheet and counting workflow?
- What tuning mistakes cause par levels to fail?
- What does a par level template look like by industry?
- What features should par level software include?
- Practical par level advice for small catering businesses
- Where practical PAR management actually pays off
- Let par levels run themselves with the right back-of-house software
- Frequently asked questions
- Sources
What is a par level and when should you use it?
Par levels work on periodic review: you count stock on a schedule (daily, twice weekly, weekly) and top it back up to a target number. That’s different to continuous review, where software watches stock in real time and fires an order automatically the moment it crosses a threshold. Periodic review trades a bit of precision for simplicity, which is exactly why it dominates industries where staff are busy doing other things.
You’ll see par levels running the show in:
- Restaurants and bars, where kitchen and bar stock gets counted on set days and topped up before the next delivery.
- Hotel housekeeping, where linen, amenities, and cleaning supplies get replenished by floor or by room count.
- Hospital supply rooms, where nursing stations keep fixed quantities of consumables and dressings on hand.
- Retail backrooms, where staff top up shelf stock from a known target rather than tracking every unit sold.
- Light manufacturing, for consumables and fasteners that don’t need SKU-level real-time tracking.
Teams choose PAR because deliveries are predictable, the counting routine is quick to teach new staff, and perishable items benefit from a human eyeballing the shelf rather than trusting a sensor.
Why par levels matter for your operation
Fewer stockouts and less waste sound obvious, but the real payoff shows up in labour. Once par levels are set, ordering stops being a daily decision and becomes a count-and-top-up task anyone on shift can do in minutes.
- Operational: fewer emergency orders, faster counting, less time spent second-guessing what to buy.
- Financial: lower spoilage on perishables, less cash tied up in excess stock, steadier cash flow.
- Service: consistent fulfilment for guests or clients, fewer scrambles to a supplier for a same-day top-up.
Sculpture Hospitality notes that replacing ad-hoc ordering with a predictable PAR routine gives high-velocity operators back real administrative hours every week, hours that usually vanish into phone calls to suppliers and last-minute stocktakes.
Par level vs reorder point: which one fits your stock?
Par level and reorder point solve the same problem from different angles. PAR is a target you top up to on a schedule. Reorder point is a trigger: when stock hits a set threshold, an order fires, regardless of the day or the count cycle. OneCart’s breakdown of periodic versus continuous review frames this well: PAR suits scheduled counting, reorder point suits systems that watch stock continuously.
Safety stock sits underneath both models. It’s the buffer you hold against demand spikes or late deliveries, and your service level target (how often you’re willing to risk running out) determines how much buffer you need.
| Factor | PAR level (periodic) | Reorder point (continuous) |
|---|---|---|
| Review style | Scheduled counts | Real-time monitoring |
| Best for | Predictable deliveries, batch counting | High-value or fast-moving SKUs |
| Data needs | Usage per period, deliveries per period | Live stock feed, daily usage rate |
| Safety stock role | Built into the PAR figure | Sits below the trigger point |
- Choose PAR when your supplier delivers on a fixed schedule and your team counts stock in batches.
- Choose reorder point when you need continuous monitoring and near real time data, typically for high-cost or high-risk items.
How do you calculate a par level step by step?
Both PAR formulas rely on the same underlying inputs. Get these right and the maths looks after itself.
The two formulas, side by side:
- Delivery-based: PAR = (Average usage per period + safety stock) ÷ deliveries per period.
- Lead-time based: PAR = (Average daily usage × lead time in days) + safety stock.
Use the first when you think in delivery cycles (three deliveries a week, say). Use the second when lead time varies more than delivery frequency, common with imported or made-to-order goods.
The inputs you need to measure:
- Average usage per period. Pull at least four to eight weeks of usage data, longer for seasonal items, and average it. A single busy week will skew your number.
- Deliveries per period, or lead time in days. Use your actual delivery cadence, not the schedule on paper. Suppliers slip.
- Safety stock. This is where service level choices bite. A common starting point is 10 to 30% of usage, with more variable items sitting at the top of that range.
Measurement tips that save you from bad numbers:
- Record real delivery dates against invoices for a month before trusting the “quoted” lead time.
- Strip out one-off events (a wedding, a promotion) from your usage average, then add them back as temporary overrides.
- Round up to the nearest case pack or minimum order quantity. A robust replenishment policy accounts for lead-time variance and pack constraints, not just the average.
Your calculation checklist:
- Pull usage data for the SKU across your chosen window.
- Compute average usage per period and confirm delivery frequency or lead time.
- Apply your safety stock percentage based on how variable that item is.
- Run the formula and round to a sensible case-pack quantity.
- Set it as the initial PAR and pilot it for two to four weeks before treating it as final.
Pro Tip: Don’t trust a quoted lead time until you’ve checked it against three actual deliveries. Suppliers often quote best-case, and your safety stock needs to cover the gap between what’s promised and what actually turns up.
Worked examples: three par level calculations you can copy
Numbers make this concrete. Here are three scenarios covering the situations most operations managers actually face.
Example 1: one delivery per period. A café orders coffee beans once a week. Average weekly usage is 40kg, safety stock is generally set as a fraction of usage; PAR = usage plus safety stock divided by deliveries. If 12kg is on hand at count time, order = 48 − 12 = 36kg.

Example 2: multiple deliveries per period. A bar restocks spirits three times a week. PAR per delivery = (30 + 8) ÷ 3 = 12.7, rounded to 13 bottles. If 4 bottles are on the shelf, order = 13 − 4 = 9, rounded up to a full case of 12 if that’s the supplier’s minimum.
Example 3: high-velocity perishable. A catering kitchen uses fresh salad greens daily, with average daily usage of 15kg and a two-day lead time. PAR = (15 × 2) + (0.30 × 15 × 2) = 30 + 9 = 39kg. Ahead of a large booking, that PAR gets a temporary override rather than a permanent increase.
| Scenario | Avg usage | Safety stock | Deliveries/lead time | PAR |
|---|---|---|---|---|
| Coffee beans | 40kg/week | 20% | 1 delivery/week | 48kg |
| House vodka | 30 bottles/week | 10 to 30% | 3 deliveries/week | 13 bottles |
| Salad greens | 15kg/day | 30% | 2-day lead time | 39kg |
- Always round toward the nearest case pack, not away from it.
- Treat event spikes as temporary overrides on top of base PAR, not permanent recalculations.
How do you set up a par sheet and counting workflow?
A par level only works if it lives somewhere your team actually checks. A par sheet is that home, usually a simple spreadsheet or a shared template, one row per SKU.
Columns your par sheet needs:
- SKU name and unit of measure
- PAR quantity and safety stock component
- Deliveries per period or lead time in days
- Minimum order quantity or case pack size
- Last count date and quantity
- Notes field for events, substitutions, or supplier issues
The weekly counting workflow:
- Assign one person per storage area to count on the same day each week.
- Count against the par sheet, not from memory.
- Record the count and calculate order = PAR − on hand immediately.
- Submit the order the same day, before the next delivery window closes.
- File the sheet so next week’s count can be compared against it.
Governance checks worth running monthly: reconcile counts against point-of-sale or usage data, require sign-off before any PAR figure changes, and schedule a spot audit on high-value SKUs. Skipping this is how par sheets drift silently out of date.
What tuning mistakes cause par levels to fail?
Par levels aren’t set-and-forget. They’re closer to a recipe you adjust as ingredients change.
- Run a short pilot on new SKUs, then compare actual usage against your PAR after two to four weeks.
- Segment by ABC classification: A-items (your highest-value or fastest movers) get tighter review, C-items can run on a longer cadence.
- Adjust safety stock per SKU rather than applying one blanket percentage across the whole stockroom.
Common mistakes to avoid:
- Using the supplier’s quoted lead time instead of what actually happens on the dock.
- Forgetting to build in a buffer for promotions, events, or seasonal menu changes.
- Letting counting slip when the team gets busy, which is exactly when accuracy matters most.
Impact Analytics makes the case that PAR levels should be treated as living documents, reviewed after supplier changes, menu shifts, or seasonal swings, rather than set once and forgotten.
What does a par level template look like by industry?
The fields on a par sheet barely change across industries. What shifts is the safety stock percentage, the review cadence, and which items get zero-tolerance treatment.
| Industry | Typical cadence | Safety stock note |
|---|---|---|
| Restaurant / bar | Weekly, some daily items | 20 to 10 to 30%, higher for perishables |
| Hotel housekeeping | Weekly | Linens counted in sets, not single units |
| Healthcare | Daily for critical items | Crash cart items often carry zero tolerance for shortfall |
| Retail | Weekly | Pooled across channels where stock is shared online and in-store |
| Manufacturing | Weekly to monthly | Tighter cadence for consumables tied to production runs |
Each industry keeps the same PAR sheet fields: SKU, unit, PAR figure, safety stock, delivery cadence, minimum order quantity, and last count. WareGo’s guide to par levels points out that hotel linens are a good example of a unit quirk: they get pared as sets rather than individual pieces, because a set is what actually gets used per room turnover.
If you’re piloting par levels for the first time, start with your fastest-moving SKUs in retail and hospitality, critical spares in manufacturing, and perishable lines in food service. Those are where a stockout or a wastage spike hurts most, and where getting the number right pays off fastest.
What features should par level software include?
Once your PAR routine is stable on paper, software removes the manual counting drag without changing the underlying logic.
Feature checklist worth comparing:
- Scheduled digital par sheets that replace the spreadsheet
- Mobile count capture, so staff enter numbers on the floor instead of transcribing later
- Pooled inventory visibility across channels or locations
- Built-in safety stock calculators tied to service level targets
- Delivery frequency fields that adjust PAR automatically as supplier schedules change
- Low-stock alerts and soft ordering that flags a suggested order for approval
Vendor categories to weigh up: entry-level inventory management systems that digitise count sheets, mid-market warehouse and inventory platforms with fuller automation, and specialised hospitality or catering back-of-house platforms that bundle PAR reminders directly into daily workflow. Established names like Unleashed, Brightpearl, and Fishbowl Inventory sit across these tiers, each suited to different scales of operation.
Exotec’s research on replenishment automation points to fewer counting errors and faster fill rates once par sheets update from near-real-time sales and receiving data, rather than a static spreadsheet nobody remembers to open.
Practical par level advice for small catering businesses
You don’t need every SKU under a par system on day one. Pick around 20 of your highest-turnover items, run weekly counts for four weeks, and compare actual usage against the PAR you calculated. Adjust from there.
Assign one person to count, keep the par sheet in one shared place, and reconcile it against invoices and event bookings monthly, not just when something runs short.
- Simple, repeatable counting beats a complex model when your data is thin, and for many small catering operations, it stays that way for good reason.
- Layer event-specific overrides on top of your base PAR rather than recalculating the whole system every time a big booking lands.
- Add automation once the manual routine is stable, not before. Bolting software onto a shaky process just automates the mess.
Pro Tip: If your par sheet has more columns than your team checks weekly, it’s too complicated. Strip it back to what people will actually use.
Where practical PAR management actually pays off
Most of the advice on inventory management assumes you’ve got clean data and a system watching everything in real time. In catering and small hospitality, that’s rarely the reality. What works is a routine simple enough that a busy chef or floor manager will actually follow it week after week.
That’s the case for keeping par levels manual and periodic for longer than the software vendors would like you to. A weekly count, a shared sheet, and a clear top-up number beat a dashboard nobody checks. The gap between what inventory software promises and what actually gets used often comes down to whether the routine survives a Friday night service, not whether the algorithm is clever.
Where automation earns its place is removing the drudge work around that routine, chasing count sheets, calculating order quantities, flagging when a par needs review, not replacing the judgement of someone who knows their kitchen.
Let par levels run themselves with the right back-of-house software
Setting a par level is the easy part. Keeping it accurate week after week, chasing count sheets, recalculating order quantities, and remembering which SKU needs a review, is where most small catering teams lose hours they don’t have. Caterflowai is built specifically for that gap: it turns your par sheets into scheduled reminders, captures counts on mobile, and pushes suggested orders straight through to your supplier list without you touching a spreadsheet.
Because it’s built for catering rather than general retail or warehousing, it handles the parts that make catering different: event-driven demand spikes, perishable stock, and the constant churn of casual staff who need to count correctly on their first shift. It also plugs into accounting platforms like Xero, QuickBooks, and MYOB, so your ordering data flows straight into your books instead of sitting in a separate app. If you’re running par levels manually and feeling the strain, start with a free audit to see exactly where the automation would save your team the most time.
Frequently asked questions
What does PAR stand for in inventory management? PAR stands for periodic automatic replenishment, sometimes shortened to just “replenishment.” It refers to the target stock quantity you top up to on a set schedule.
What is the simplest par level formula? PAR = (average usage per period + safety stock) ÷ deliveries per period. If you think in lead time instead of delivery frequency, use average daily usage multiplied by lead time in days, plus safety stock.
How is par level different from reorder point? Par level is a target you top up to on a schedule (periodic review). Reorder point is a threshold that triggers an order automatically the moment stock falls below it (continuous review).
How much safety stock should I hold?
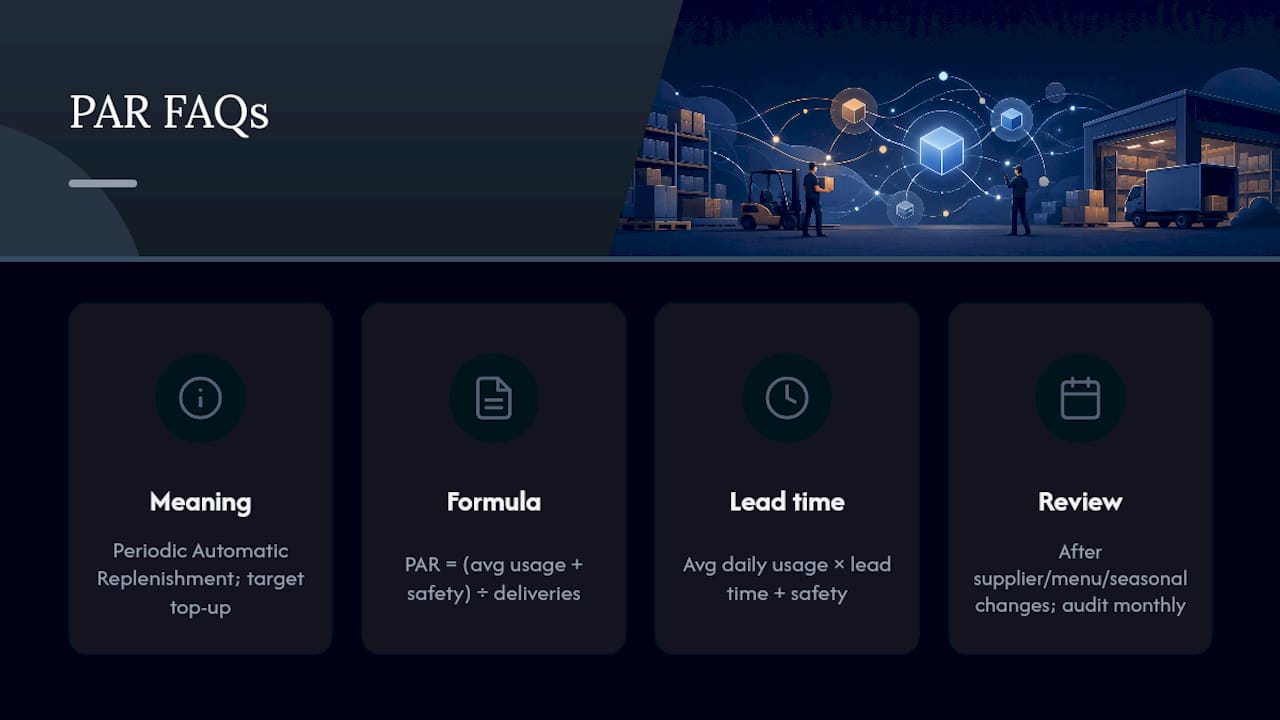
How often should I review my par levels? Review after any supplier change, menu shift, or seasonal swing, and audit high-value items monthly at minimum. Treat par levels as figures that need occasional recalculation, not permanent settings.
Sources
- How to calculate optimal inventory level | Cleverence
- Four inventory replenishment strategies to consider | Taulia